

Indicators & Systems for Active Traders
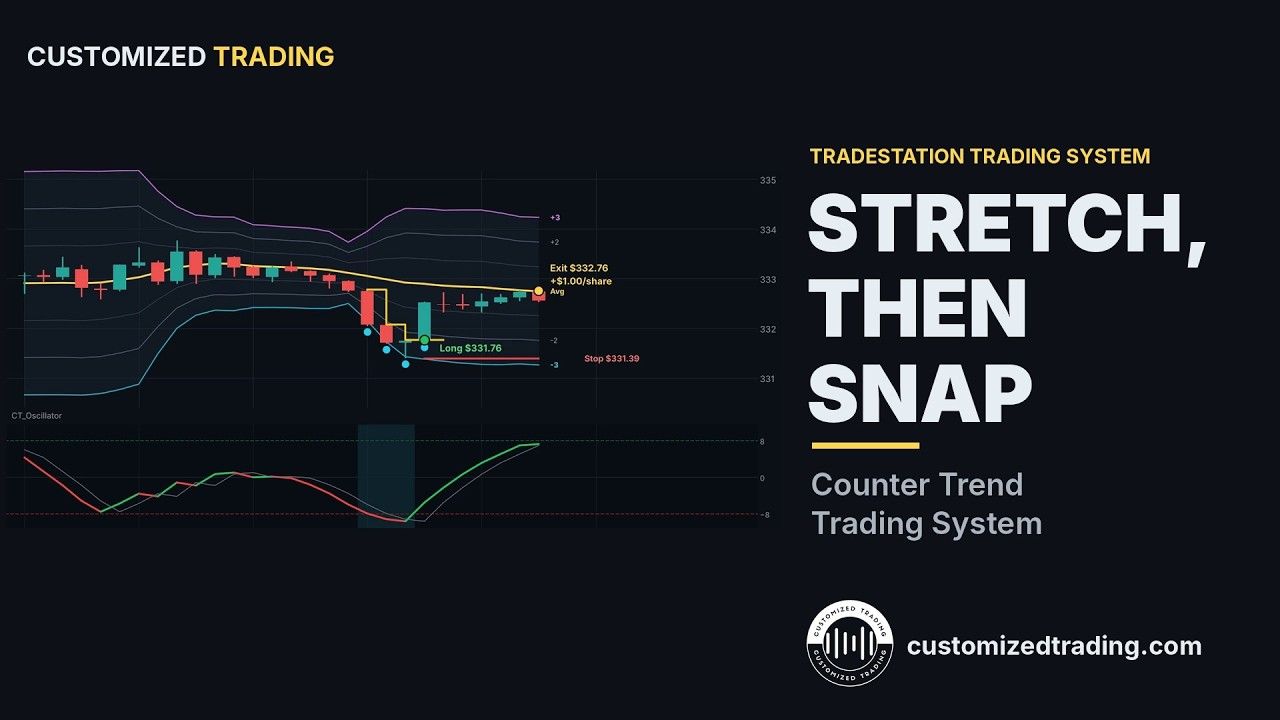
The Counter Trend Trading System is a toolkit for finding and trading Bollinger Band extreme reversals: moves where price has stretched well beyond its normal range and is likely to snap back toward the mean. It combines multi-timeframe Bollinger Band analysis, oscillator confirmation, linear regression context and a semi-automated order entry strategy into one scan-to-execution workflow.
The package contains 10 components in three groups.
CT_BB_Extreme: the core setup detector. It tracks price against a 21-bar, 2-standard-deviation Bollinger Band in two steps:
CT_BollingerBands3L: draws Bollinger Bands at ±1, ±2 and ±3 standard deviations. Use it on the same chart as CT_BB_Extreme to see which band was breached and how far price has stretched beyond it.
CT_LinearRegChannel: draws a linear regression channel (a regression line with ±2 SD boundaries) over the last 144 bars by default. Price that is outside the Bollinger Bands and at the edge of the regression channel is a stronger mean-reversion case than a band extreme alone. It also works in RadarScreen and Scanner, where it shows each symbol's position in its channel and flags four signals. The two counter-trend signals, Sell C-Trend (a stretch to the top of a rising channel) and Buy C-Trend (a stretch to the bottom of a falling channel), are the ones this system is built around.
CT_MTF_Price_Gapless: gapless trend lines for eight timeframes on one chart (the chart's interval, 15, 20, 30, 60, 120 and 240 minutes, and daily). Use it to see whether a counter-trend entry is fighting the higher timeframes or lining up with them.
CT_Oscillator: a Stochastic RSI momentum oscillator in a subgraph. Below −8 and turning up confirms a long counter-trend entry; above +8 and turning down confirms a short. Alerts fire at both levels.
CT_MTF_BB_Pct_Composite: calculates Bollinger Band %B on six timeframes at once (the chart's interval plus 10, 15, 20, 30 and 60 minutes) and combines them into one weighted composite, plotted in a subgraph under a 5-minute chart. A reading near +2 or −2 means price is stretched on most timeframes at the same time. A Cyan marker (buy) or Magenta marker (sell) appears when the composite turns back from an extreme. Works on stocks, futures and CME crypto futures.
CT_BB_Extreme_RS: scans your watch list for Bollinger Band extremes. Each cell shows where the close sits in its 21-bar band; it turns Dark Red at the upper extreme (potential short) and Dark Green at the lower extreme (potential long), the same colors as CT_BB_Signals_RS. It also counts the bars since the extreme, so a low count means it happened recently.
CT_BB_Signals_RS: shows each symbol's position in its 20-bar band and tracks a band-touch setup through to its trigger. Dark Red = closed at the upper band, waiting for a trigger; Red = the short setup has triggered. Dark Green and Green are the long-side mirror. Use it with CT_BB_Extreme_RS: one shows how far price is stretched, the other shows when it starts to turn back.
CT_RS_Position_Size: calculates the recommended trade size (shares or contracts), the stop distance in ticks and the stop distance in dollars for each symbol, from your account balance, risk percentage (default 1%) and a volatility-based stop.
CT_TL_Trader: a semi-automated order entry strategy. Drag a trend line on the chart to your entry price and the strategy places the order when price reaches it. It supports three interactive lines (primary entry, secondary entry and market order). Line colors show the pending order type: White = inactive, Dark Green/Dark Red = stop orders, Green/Red = limit orders, Yellow = stop loss, Cyan = profit target. Position size can be fixed, or calculated from your account balance, risk percentage and the entry-to-stop distance.
Why look at Bollinger Band extremes on several timeframes?
An overbought or oversold reading on one timeframe can last for many bars in a strong trend. CT_MTF_BB_Pct_Composite combines six timeframes, so a reading near ±2 means price is stretched on most of them at once rather than on one calculation period. It's a filter for the broader stretch, not a guarantee of a reversal.
What is the two-step signal in CT_BB_Extreme?
First the close must reach a Bollinger Band extreme. That starts the setup and the trailing level. Second, the close must cross back through the trailing level in the reversal direction, which is the entry trigger. Waiting for the second step avoids entering at the first touch of the band, when price may keep stretching.
Does it work for both long and short setups?
Yes. Every component handles both sides: upper-band extremes for short entries and lower-band extremes for long entries.
Do I have to set up the charts myself?
No. Import the ELD file, then open one of the three included workspaces. Every study is already on the RadarScreen and the charts, and clicking a symbol in RadarScreen loads it into all the charts. Enter your account balance and risk percentage in the position sizing study and the strategy before trading.
How do I know if my data connection drops?
TradeStation alerts you when the data connection is lost, and past connection events are listed in its Message Center.
Are future updates included?
Yes. All future updates to the Counter Trend Trading System are included at no additional cost to existing customers.
What is your refund policy?
All sales are final. Review the product documentation and the Learning Center before purchasing. If you have a technical issue after purchase, contact [email protected].
Trading involves substantial risk of loss. Past performance, including backtest results, does not guarantee future results.
Our indicators and trading systems are built by active traders, not software developers — every tool in this library exists because we needed it ourselves. That means each product solves a specific, real-world trading problem: the Fractal Channel Indicator gives you non-repainting support and resistance based on actual price structure, the MTF Price Action Indicator Set eliminates the need to manually correlate multiple charts, and the Risk Reward Indicator automates stop placement and position sizing on every trade.
Every indicator is built around multi-time-frame confirmation — the single most reliable edge available to independent traders. Our MTF suite covers RSI, MACD, ADX, Stochastic, VWAP, Floor Trader Pivots, and Fractal Channel, all displaying multiple time frames simultaneously on a single TradeStation chart. When a signal is confirmed across four, six, or eight time frames at once, the probability of a successful trade improves significantly over any single-time-frame analysis.
Our complete trading systems — the Scalper Day Trading System, MTF Trend, and MTF Consolidation Breakout — go beyond individual indicators. Each system combines RadarScreen scanning, multi-time-frame analysis, chart-based execution, and automated exit management into a fully integrated workflow. Your computer does the scanning; you make the trading decisions.
All products are instant digital downloads for TradeStation 10 and later, compatible with any market and any chart type. Every purchase includes a step-by-step installation guide, Learning Center video access, and email support. Future updates to all trading systems are included at no additional cost.