Reduce the Emotional Stress of Trading
We recommend that every trader have rules about draw down periods including when to trade and when not to trade any given strategy. One idea we find helpful is to actually monitor the equity curve on each trading chart to give a third party objective view on the strategy's performance.
Most traders understand that any given strategy has winning periods where the strategy does really well and losing periods called draw downs where the strategy gives back some of the money it gained. This reoccurring cycle of profit periods and draw down periods happens because every strategy is made to capitalize on certain market patterns and/or market modes. For example if a strategy is made to capitalize on a smooth upward trend, then that strategy will do extremely well during smooth upward trend periods. But if you trade that strategy during a different market mode than what it was designed for, like during a choppy market, then the strategy will experience a draw down period.
Traders intellectually know these profit periods and draw down periods occur, but in practice their emotions get in the way of seeing these reoccurring cycles for what they are. I have seen traders successfully trade an automated strategy for multiple months, but then the strategy has five losses in a row and they quit trading it. They say the strategy is suddenly broken or any number of other rationalizations to justify why they stopped trading a strategy that was working for them with good success. All kinds of different psychological barriers come up for traders when they enter a draw down period. Many traders have an overly active risk aversion and that risk aversion causes doubts and negative mental chatter making it difficult to think clearly. The bottom line is the vast majority of traders have never developed any rules for what they should do during a draw down period. Since they aren't sure what they should do, their mind chatter sets in and they make emotion based knee jerk trading decisions.
I recommend that every trader have rules about draw down periods including when to trade and when not to trade any given strategy. One idea I find helpful is to actually monitor the equity curve on each trading chart to give a third party objective view on the strategy's performance. I'm not talking about the price action on the chart; I am talking about the actual equity curve of the trading profit. When the equity curve is rising, that's when you should be trading your strategy. When the equity curve is dropping, that's when you should paper trade that strategy.
Every strategy goes through cycles of equity run-ups and equity draw downs. When periods of equity draw downs happen, it doesn't mean that there is something wrong with the strategy. When you should trade a specific strategy depends on what market mode that strategy was designed to take advantage of. When the strategy design is in sync with the current market mode that is the time when that strategy is going to make money. When the strategy design is not in sync with the current market mode that is the time when the strategy is going to give back money. This is the nature of all automated trading strategies. If you plan to trade an automated strategy you must understand these reoccurring cycles and have rules to help you manage them.
Understanding these cycles will help you understand why there is no such thing as a "holy grail" trading strategy. Traders continually search for this mythical strategy that has an incredibly high percentage of winners and never has any draw down periods. No such strategy exists. If you find a strategy that has a really high percentage of winners, most of the time that strategy has an inverted risk reward ratio. This means the strategy employed a high risk approach and thus the risk is too high for this to be a good strategy to trade. This approach literally has inverted the golden rule of trading.
Let's get practical about how you can implement a proper rule to handle draw down periods. First, to identify when you are entering a drawdown period let's use a fast moving average and slow moving average based on your equity curve (not on price). When the fast equity curve line moves below the slow equity curve line, this is the signal to paper trade that strategy. When the fast equity curve line moves above the slow equity curve line, this is the signal to start live trading that strategy. Now you have a well defined rule to identify draw down periods and how you will properly manage your trading to minimize your draw down losses.
Trading your equity curve is like having an objective third party monitoring each trading chart to tell you when to live trade vs. when to paper trade. You can eliminate one more of the emotional stresses in trading by using the equity tracing concept to control your draw down period losses.
Why Choose Us?
Are you tired of struggling to find profitable trades? Are you looking for an edge in the markets? Look no further than our custom indicators and trading systems for TradeStation.
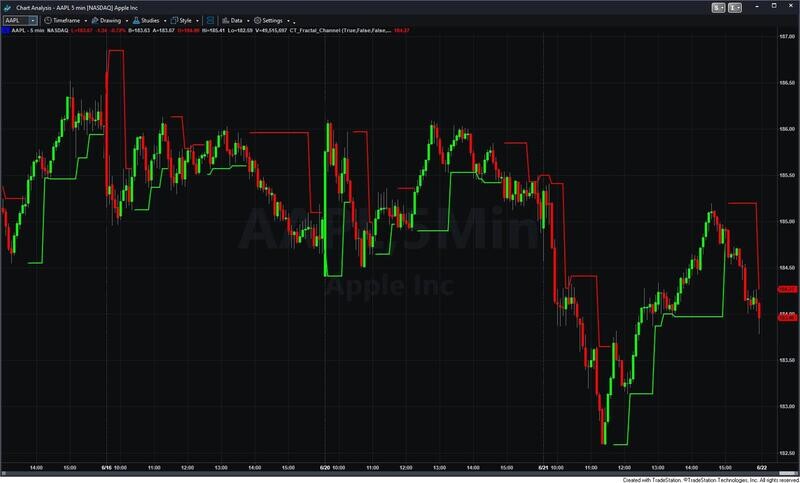
Gain a trading edge with our Price Action and Fractal Channel indicators, which can help you spot high probability trade set-ups.
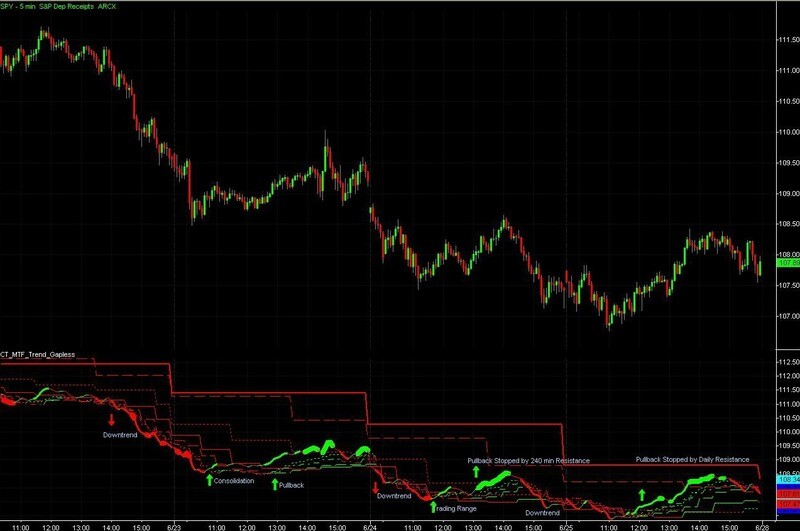
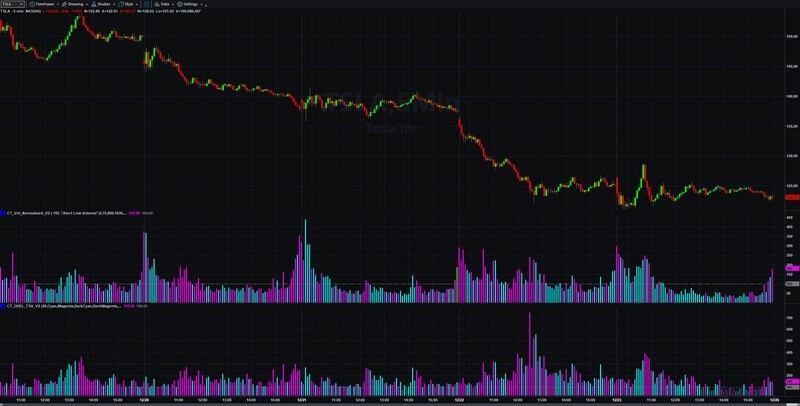
Understand the power of Multiple Time Frames and Time Based Volume to take advantage of trading opportunities across different timeframes.
Our complete Turnkey Trading Systems operate on any Forex, Futures, and Stock symbols, and include a Visual Chart Trading strategy to execute trades directly from your charts.
Experience the power of computer-assisted trading, combining the strengths of human intuition and expertise with the sophistication of indicators and RadarScreen.
Let our expert-level Trading Indicators and RadarScreen do the heavy lifting of finding possible trades and managing trade exits, so you can focus on what you do best - making trading entries.
Our Learning Center is filled with free educational articles and trading videos to teach you about the Art of Successful Trading.
Learn about the critical fundamentals for profitable trading and enhance your knowledge about the Art and Science of Successful Trading.
Ready to start trading smarter? Browse our products and get started today. Transform your trading with custom indicators and strategies for TradeStation. Gain the trading edge you need to succeed in the markets.
