Boost Your Profits
The Fractal Channel Indicator covers the essential concepts of real time support and resistance that every trader should understand if they expect to be successful at trading. Read through this article for a clear understanding of the 3 vital aspects of trading; price action, volume (time based volume), and real time support and resistance. Of these three, price action is the most critical.
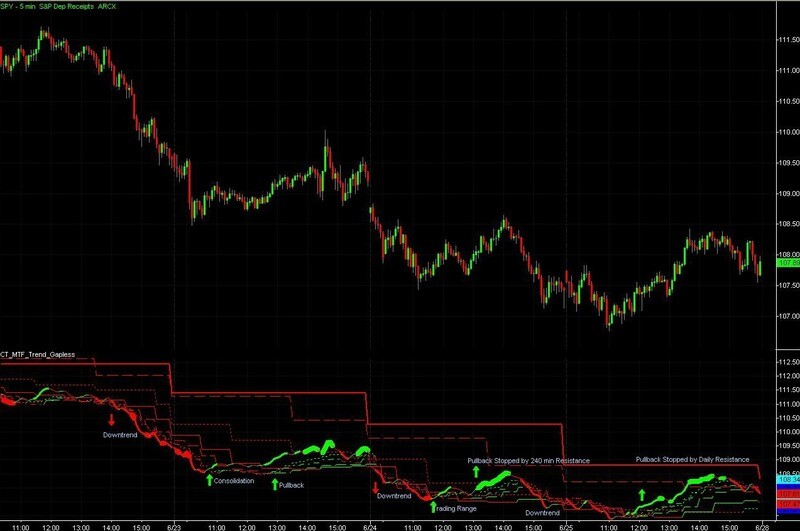
Price and time are what creates price action in the form of bars or candlesticks on your trading charts. Understanding price action is critical. If you try to trade against price action, you will lose money. Price is always right, and it never takes your opinion into consideration. Traders will all too often get sidetracked into searching for some magic indicator, many of which have tremendous lag. These typical lagging indicators are too far removed from price action to be the basis for making trading decisions. Traders that primarily use these lagging indicators can end up making correct decisions based on bad indicators which results in losing trades. We have 6 articles and associated video that cover using Multiple Time Frame Price Action in detail located under the "Learning Center" tab of this web site.
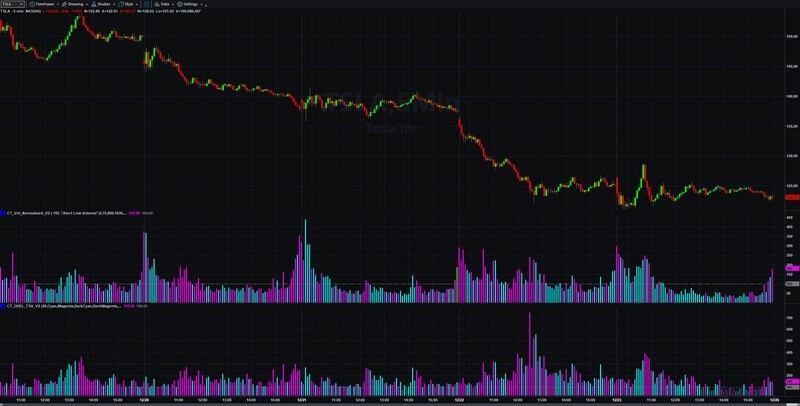
The second vital point to consider is volume. Volume is hard to understand if you use the typical volume indicators like average volume. For detailed coverage on volume see the article titled “Time Based Volume Indicator - The Undistorted Volume Indicator.”
It is price action and volume action that creates the price bars on your trading chart and every chart shows support and resistance areas. When price is moving up 4, 5, or 6 bars in a row, and all of sudden it stops moving up, that might be from selling volume pushing the price the other way as the bears take over control. This price action change of direction is a resistance point. Support and resistance really is about where price changes direction.
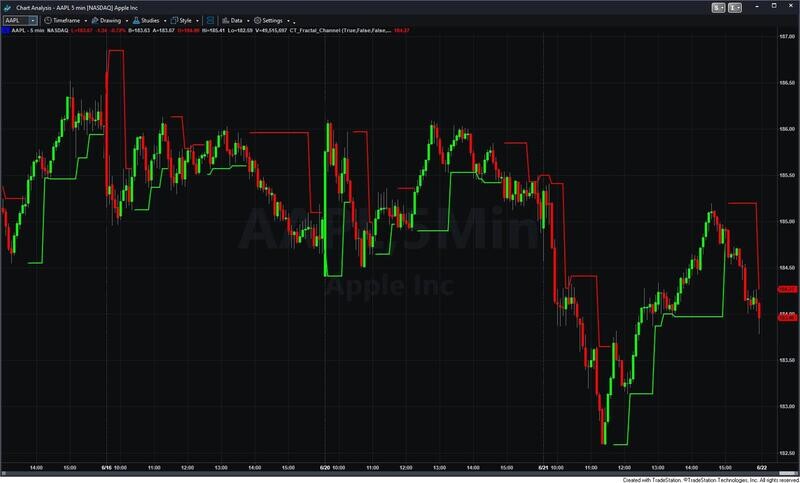
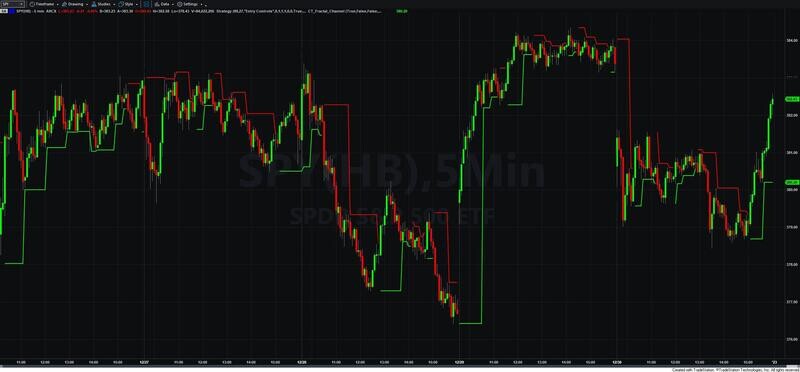
Most traders only see support and resistance after the fact. It is really easy to look at something after the fact and say, “oh, had I done ‘such and such,’ that would have been a good trade.” Hind sight is worthless in trading. The Fractal Channel Indicator displays real time support and resistance and shows in real time where these changes in price action happen, giving you a good visual illustration of where to place your trade entries. For instance; if price is moving down and stops at the fractal channel, meaning stops at a prior level of support, and then starts moving back up, this is a good entry point.
For this example once you are in a long trade, the fractal channel will move up with each new support point that develops, showing a series of higher support points (an up-trend). The fractal channel shows the direction of the trend with a green trend line to display these higher high support points.
Another useful purpose for seeing support and resistance is for proper stop loss placement. Most traders decide where they want to place their stop loss based on some arbitrarily dollar amount of risk. This really makes no sense from a technical trading stand point. What does make good technical sense is for you to place your stop loss underneath a prior support area for a long trade. If the support doesn’t hold, then you want to be out of that trade anyway. That is the proper placement of a stop loss. So the fractal channel becomes very useful not only for entries based on support and resistance, but for fractal channel stop loss exit management too. The Fractal Channel allows you to place your stop loss based on support and resistance, and as you make profit in your trade, moving your stop as a trailing stop to lock in more profits. This support and resistance approach is an intelligent stop loss placement methodology.
The fractal channel also helps with position sizing. If you plan to make a long trade you know where the support is and your stop loss should be under this area. That distance from the entry price to the stop loss price is the risk per share which is the basis for good position sizing. You calculate your position sizing from using a certain percentage of your account balance divided by the stop loss risk per share amount and you come up with the appropriate position size for that trade entry.
Setting your stop loss below the support area and moving the trailing stop up based on support areas often allows the trade to run for quite a while before you exit the trade, which means more profitable trades. The last thing you want to do is exit a long trade prematurely when the fractal channel is still going up and still showing you are in a long trend. The fractal channel is a great tool in that regard.
The fractal channel assists the trader in all three important areas: trade entry, trade stop loss placement, and position sizing. Since the fractal channel tracks where price changes direction in real time you will see the best points to make your entries. By having real time support and resistance lines available, you can better manage your trade exits and know exactly the best technical placement for your stop loss. The price distance from entry to stop loss placement provides you the risk amount per share so you can properly calculate position sizing for each trade. By managing your trades this way on your TradeStation platform, you will be much more successful at squeezing a lot more profit out of your trades.
Watch the video named "Fractal Channel" to see how your Trading Charts can show "real time" support and resistance:
After you have finished the first 9 "Learning Center" articles and videos covering the Multiple Time Frame Price Action, Time Based Volume and Fractal Channel you are ready to see how all of this information comes together to provide you enhanced trading entry set-ups in this video titled "Applying What You Have Learned To Create Powerful Trading Set-Ups"".


Why Choose Us?
Are you tired of struggling to find profitable trades? Are you looking for an edge in the markets? Look no further than our custom indicators and trading systems for TradeStation.
Gain a trading edge with our Price Action and Fractal Channel indicators, which can help you spot high probability trade set-ups.
Understand the power of Multiple Time Frames and Time Based Volume to take advantage of trading opportunities across different timeframes.
Our complete Turnkey Trading Systems operate on any Forex, Futures, and Stock symbols, and include a Visual Chart Trading strategy to execute trades directly from your charts.
Experience the power of computer-assisted trading, combining the strengths of human intuition and expertise with the sophistication of indicators and RadarScreen.
Let our expert-level Trading Indicators and RadarScreen do the heavy lifting of finding possible trades and managing trade exits, so you can focus on what you do best - making trading entries.
Our Learning Center is filled with free educational articles and trading videos to teach you about the Art of Successful Trading.
Learn about the critical fundamentals for profitable trading and enhance your knowledge about the Art and Science of Successful Trading.
Ready to start trading smarter? Browse our products and get started today. Transform your trading with custom indicators and strategies for TradeStation. Gain the trading edge you need to succeed in the markets.
