The Undistorted Volume Indicator
Many traders ignore volume. Although volume is a simple concept, it is difficult to analyze correctly due to inherent challenges in the markets. These challenges make it impossible to read true volume with standard volume indicators. Read through this article to learn the best way to overcome volume distortions and how using the Time Based Volume Indicator will increase your trading "edge".
Often traders use average volume indicators where the average of volume is calculated over a given number of past bars to see if volume is increasing or decreasing over that time period. It is okay to look at volume this way, but you will be missing the most vital volume information. This is not the best approach to analyze volume.
Volume has inherent distortions which cause faulty analysis by many traders. For example in the stock market (and other markets to a lesser degree), the opening of the day is fraught with a multitude of orders that had built up overnight and all get processed at once. This large influx of trade volume creates a major distortion to what is actually happening in the market.
Another distortion is created in the middle of the day when the majority of market makers go to lunch and market activity slows down immensely. This is called the lunch doldrums.
A third distortion happens at the end of the day, when traders try to adjust their orders before the market closes. They may want to be flat overnight or they might want to get into a trade, but this influx of orders at the end of the day is another distortion to volume.
Watch the video named "Time Based Volume Indicator" to see what "real" trading volume looks like:
Another inherent challenge to using a volume average indicator is that every instrument has considerably different levels of volume. For example compare, GE with 40 million shares per day vs. a stock with 100,000 shares per day. This vast difference makes it difficult to read volume from one symbol to another symbol.
Additionally, if you change from one time frame to another there will be huge volume differences. The volume on a 1 minute bar chart is much different than the volume on a 60 minute bar chart or a daily chart. The key to getting past these challenges is to use our TradeStation Volume Indicator called Time Based Volume.
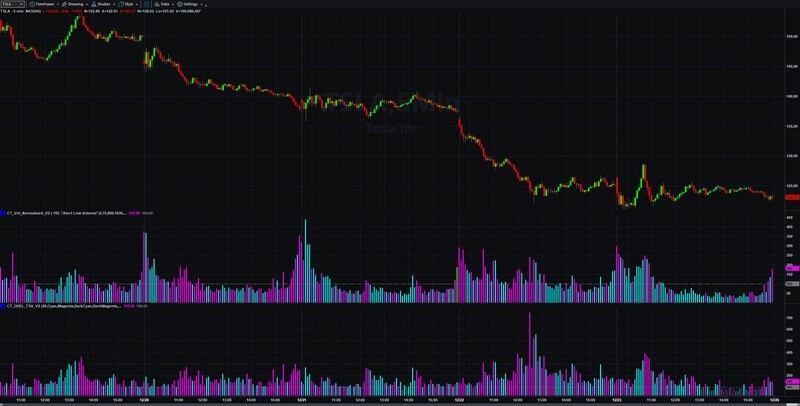
Time Based Volume is the way to get consistent volume data and eliminate all the volume distortions that we discussed above. Here's the key to why time based volume works: Let's start with volume on a 5 minute chart and for this example, look at the 10:15 bar. Now take the average of only the 10:15 bars over the prior month and compare that average to the current 10:15 bar. The difference will give a true reading on whether today's 10:15 bar volume is higher or lower in comparison to the exact same time bars over the past month.
Now when you read the 10:15 bar you read the price bar against the volume bar. For example, let's say the price action shows a larger than normal bar, maybe 2 times normal. Let's say price started out close to the bottom of the bar with no wick, and it runs up and closes close to the top of the bar. This means a strong bullish bar, but if you look down and you see less than average volume, then you should be cautious about the price movement. In contrast, if you see 200% or 300% percent volume you'll know that increased volume was the reason for the extra large price bar. In this last example the price bar and volume bar are in harmony.
Alternatively, if you saw that same 200% - 300% volume bar, but the price action looked completely different, let's say it was a bar that was only 1.5 times normal size. Let's say it started very close to the bottom for the open, it ran up to a high and then it pulled back and closed in the lower third of the bar range, this is a bearish sign. Now this example shows a major switch took place during that bar and the volume was cause by bearish selling volume (not buying volume). The sellers came in and over powered the buyers and pushed it from the top of the range clear down into the bottom of the range before the bar closed. If this bar occurred at the end of a multiple bar move up it is probably the end of the upward thrust and it might be time to reverse your trade direction.
The key to understanding volume is reading price action and volume action on the same exact bars, using time based volume to give you the true volume information you need, and reading the chart to see if price and volume are in harmony or if they are divergent. This approach uses the Time Based Volume Indicator to confirm the price breakout, make you suspect of a given price move, or tell you if it is the end of a price movement and high chance a change in direction is coming. No matter what the markets might present, using time based volume will eliminate volume distortions and increase your trading "edge".
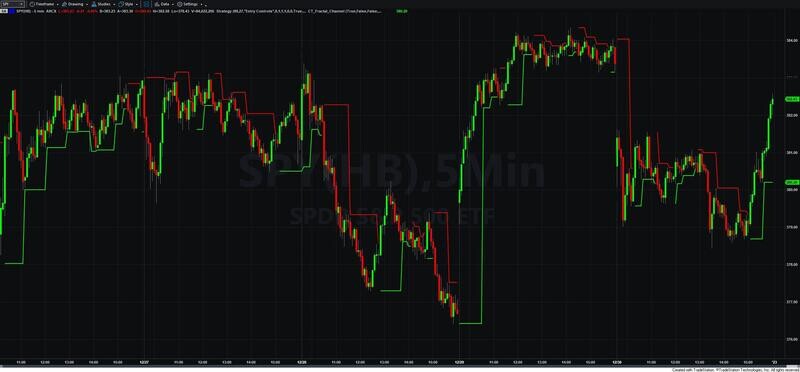
Next is the third most important topic which is "real time" support and resistance covered in this article and associated video titled "Fractal Channel Indicator – Boost Your Profits with Real Time Support and Resistance".
Why Choose Us?
Are you tired of struggling to find profitable trades? Are you looking for an edge in the markets? Look no further than our custom indicators and trading systems for TradeStation.
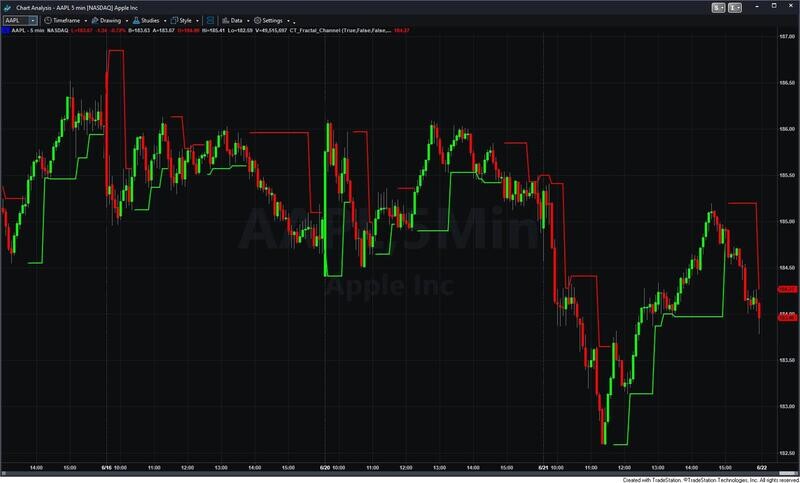
Gain a trading edge with our Price Action and Fractal Channel indicators, which can help you spot high probability trade set-ups.
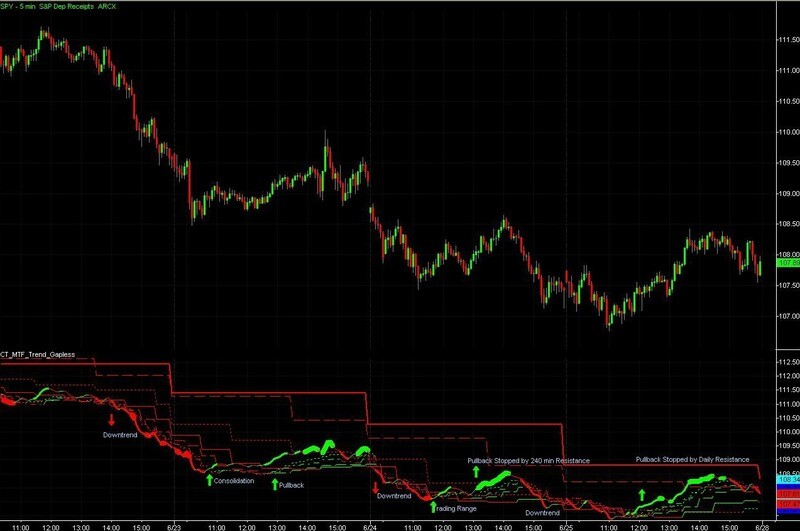
Understand the power of Multiple Time Frames and Time Based Volume to take advantage of trading opportunities across different timeframes.
Our complete Turnkey Trading Systems operate on any Forex, Futures, and Stock symbols, and include a Visual Chart Trading strategy to execute trades directly from your charts.
Experience the power of computer-assisted trading, combining the strengths of human intuition and expertise with the sophistication of indicators and RadarScreen.
Let our expert-level Trading Indicators and RadarScreen do the heavy lifting of finding possible trades and managing trade exits, so you can focus on what you do best - making trading entries.
Our Learning Center is filled with free educational articles and trading videos to teach you about the Art of Successful Trading.
Learn about the critical fundamentals for profitable trading and enhance your knowledge about the Art and Science of Successful Trading.
Ready to start trading smarter? Browse our products and get started today. Transform your trading with custom indicators and strategies for TradeStation. Gain the trading edge you need to succeed in the markets.
